
App / Trading simulator
OptSim 225
日経平均先物・オプションに特化した取引シミュレーターです。実際の発注機能はなく、オプション戦略やリスク指標を試しながら学べます。実際のお金を動かす前の学習・検証にご活用いただけます。
A trading simulator dedicated to Nikkei 225 futures and options. It has no order-placement function, so you can learn option strategies and risk metrics by trying things out, for study and practice before putting real money on the line.

Specification
- 対象ユーザー / Audience
- 初心者〜中級者Beginners to intermediate users
- 対象銘柄 / Instruments
- 日経平均先物(ラージ・ミニ・マイクロ)、オプション(通常・ミニ)Nikkei 225 futures (Large, Mini, Micro) and options (standard, mini)
- 対応環境 / Platform
- Android(Google Play)Android (Google Play)
- 表示言語 / Language
- 日本語・英語Japanese and English
Screenshots
画面 / Screens
01 · Positionsポジションを、
まとめて管理。オプションと先物を組み合わせ、グループで整理。原資産とIVを動かして評価損益を試せます。All your positions, one place.Combine options and futures, organise them in groups, and test P&L by moving the underlying and IV.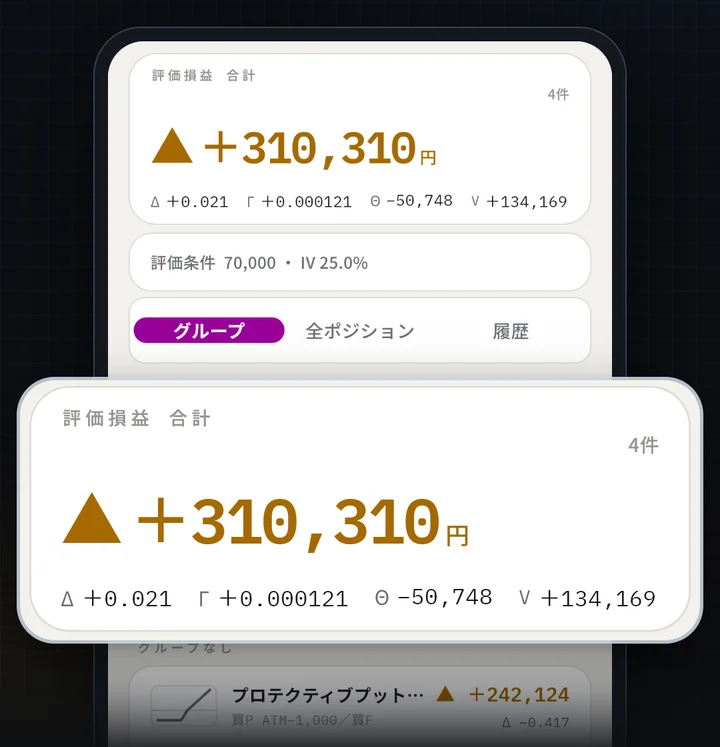
02 · Payoff複数ポジションを、
1枚のペイオフ図に。グループにまとめたポジションの損益を合成。損益分岐点・最大利益・最大損失も。Many positions. One payoff chart.Group positions and see their combined payoff, with break-evens and max profit and loss.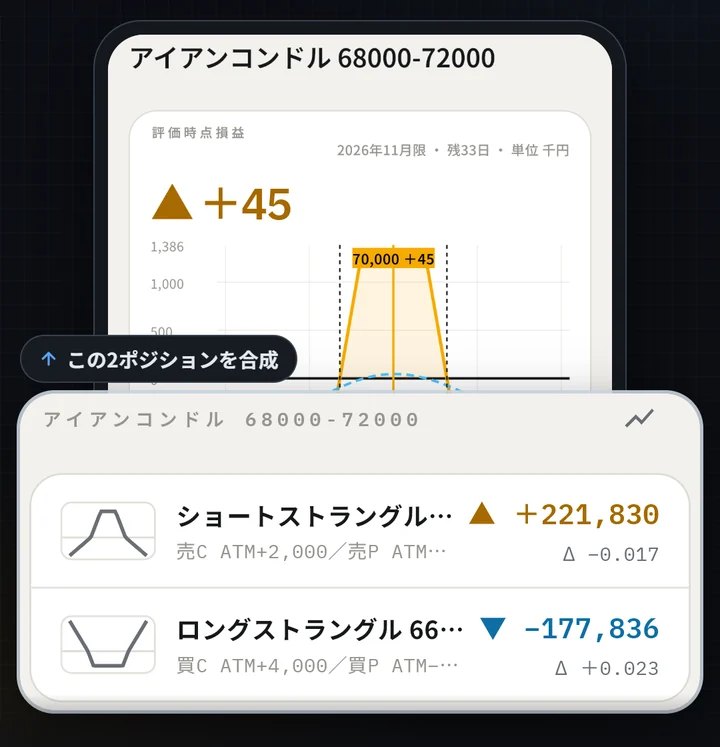
03 · VaR margin証拠金の目安も、
事前に。保有ポジションのVaR概算を確認(参考値)。登録不要・端末内保存・オフラインで動作。Gauge margin in advance.A portfolio VaR estimate for your positions (reference). No sign-up, stored on device, works offline.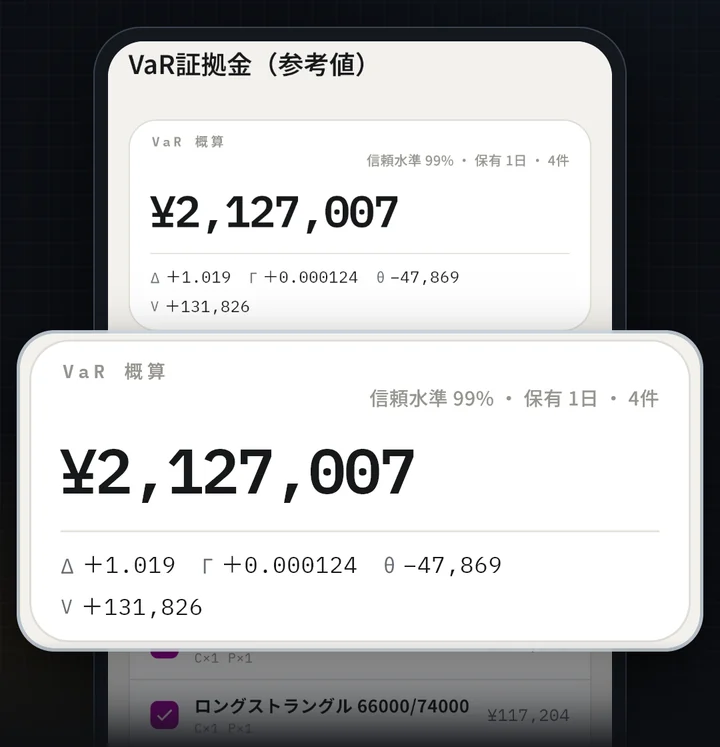
主な機能 / Features
- 触るたびに結果が変わる条件を変えると、理論価格・評価損益・VaR がその場で更新されます。基準との差を表示する比較モードもあります。Results update as you touch them. Change a condition and the theoretical price, P&L and VaR update on the spot. A comparison mode shows the difference from a baseline you set.
- 戦略サジェスト強気・弱気・レンジ・荒れる、といった相場観別に代表的なオプション戦略を一覧し、カードから仮想ポジションを作成できます。Strategy suggestions. Browse typical option strategies by market view (bullish, bearish, range-bound, volatile) and create a virtual position from any card.
- ポジション管理オプション・先物を組み合わせた仮想ポジションを作成し、評価損益を確認できます。原資産価格と IV を動かして、評価損益の変化を試せます。Position management. Build virtual positions from option and futures legs and check the valuation P&L. Move the underlying price and IV to see how it changes.
- ペイオフダイアグラム満期時点と評価時点の損益曲線をグラフで表示し、損益分岐点・最大利益・最大損失を確認できます。Payoff diagram. P&L curves at expiry and at the valuation point are plotted, with breakeven points, maximum profit and maximum loss.
- オプションチェーンATM を中心に上下4,000円分(125円刻み)のブラック・ショールズ理論価格を一覧表示します。コール/プットの理論価格とデルタを並べて確認できます。Option chain. Black-Scholes theoretical prices from 4,000 points below to 4,000 points above ATM (125-point steps), with call and put prices and delta side by side.
- ブラック・ショールズ評価理論価格とグリークスを計算し、本質価値と時間価値の内訳、プット・コール・パリティの検算も表示します。Black-Scholes evaluation. Theoretical prices and Greeks, with the intrinsic and time value breakdown and a put-call parity check.
- VaR 証拠金シミュレーション(参考値)保有ポジションのポートフォリオ VaR の概算値を計算し、証拠金の目安を確認できます。VaR margin simulation (reference). An approximate portfolio VaR for your positions gives a rough idea of margin.
- シナリオ分析(参考値)原資産の変動率(±20%)と、残存日数または IV の変化を組み合わせた損益をヒートマップで一覧できます。モンテカルロ法(10,000回の試行)で、満期時点の損益の分布と下振れリスクの目安も確認できます。Scenario analysis (reference). P&L on a heat map combining the underlying's move (±20%) with days to expiry or a shift in IV. A Monte Carlo run of 10,000 trials also shows the distribution of P&L at expiry and a rough picture of downside risk.
- 見やすさと始めやすさカラーユニバーサルデザイン(CUD)に準拠した配色、桁が揃う等幅の数字、ライト/ダークテーマに対応しています。アカウント登録は不要で、ポジションや設定は端末内に保存され、基本機能はオフラインで動作します。Built to be read and easy to start. A colour universal design (CUD) palette, monospaced figures that line up, and light and dark themes. No account registration is needed; positions and settings are stored on your device, and core features work offline.
対象ユーザー / Who It Is For
- 日経平均オプションの仕組みをこれから学びたい方Anyone starting to learn how Nikkei 225 options work
- 戦略ごとの損益イメージ(ペイオフ)を視覚的に確認したい方Those who want to see each strategy's payoff visually
- ブラック・ショールズ理論価格やグリークスを手軽に計算したい方Those who want to calculate Black-Scholes prices and Greeks easily
- 証拠金の概算感を事前につかんでおきたい方Those who want a rough feel for margin requirements in advance
ご利用にあたって / Before You Use It
- 本アプリはシミュレーション専用の学習ツールです。実際の取引を仲介・発注する機能はありません。This app is a study tool for simulation only. It has no function to broker or place actual trades.
- 表示される理論価格・IV・VaR などはすべて概算・参考値であり、実際の市場価格や証券会社が算出する必要証拠金とは異なります。正確な数値・制度は、取引先の証券会社および各公式情報でご確認ください。All displayed theoretical prices, IV, VaR and other figures are approximate reference values and differ from actual market prices and the required margin calculated by brokerages. Please confirm accurate figures and rules with your securities broker and each official source.
- デリバティブ取引(先物・オプション)は、相場の変動により元本を大きく超える損失が生じる可能性があります。取引を行う前に、契約締結前交付書面等をよくお読みください。Derivatives trading (futures and options) may incur losses far exceeding your principal. Read the pre-contract documents before trading.
- 本アプリは特定の銘柄・取引を推奨するものではありません。投資の最終判断は、ご自身の責任で行ってください。This app does not recommend any specific instrument or transaction. Make your final investment decisions at your own responsibility.
商標 / Trademarks
「日経平均株価」「日経平均」「日経225」等の名称および関連する商標に関する権利は、日本経済新聞社および日経知財管理に帰属します(出願中のものを含みます)。本アプリは、両社ならびに大阪取引所および日本取引所グループとは一切関係がなく、これらの承認・後援・推奨を受けたものではありません。
"Nikkei 225" and related marks are the property of Nikkei Inc. and Nikkei Intellectual Property Management Co., Ltd. (some applications pending). This app is not affiliated with, endorsed or approved by them, Osaka Exchange, Inc. or Japan Exchange Group, Inc.
Google Play および Google Play ロゴは Google LLC の商標です。
Google Play and the Google Play logo are trademarks of Google LLC.
アプリが扱う情報については、プライバシーポリシーをご覧ください。
For how the app handles information, see the Privacy Policy.